Creating a Simple Bar Graph with HTML and CSS
Sometimes you need to a handful of data points, but you don't want to add a dependency for a full charting library such as Highcharts or Chart.js. Luckily, it's easy to create nice looking, responsive bar graphs using only HTML and CSS.
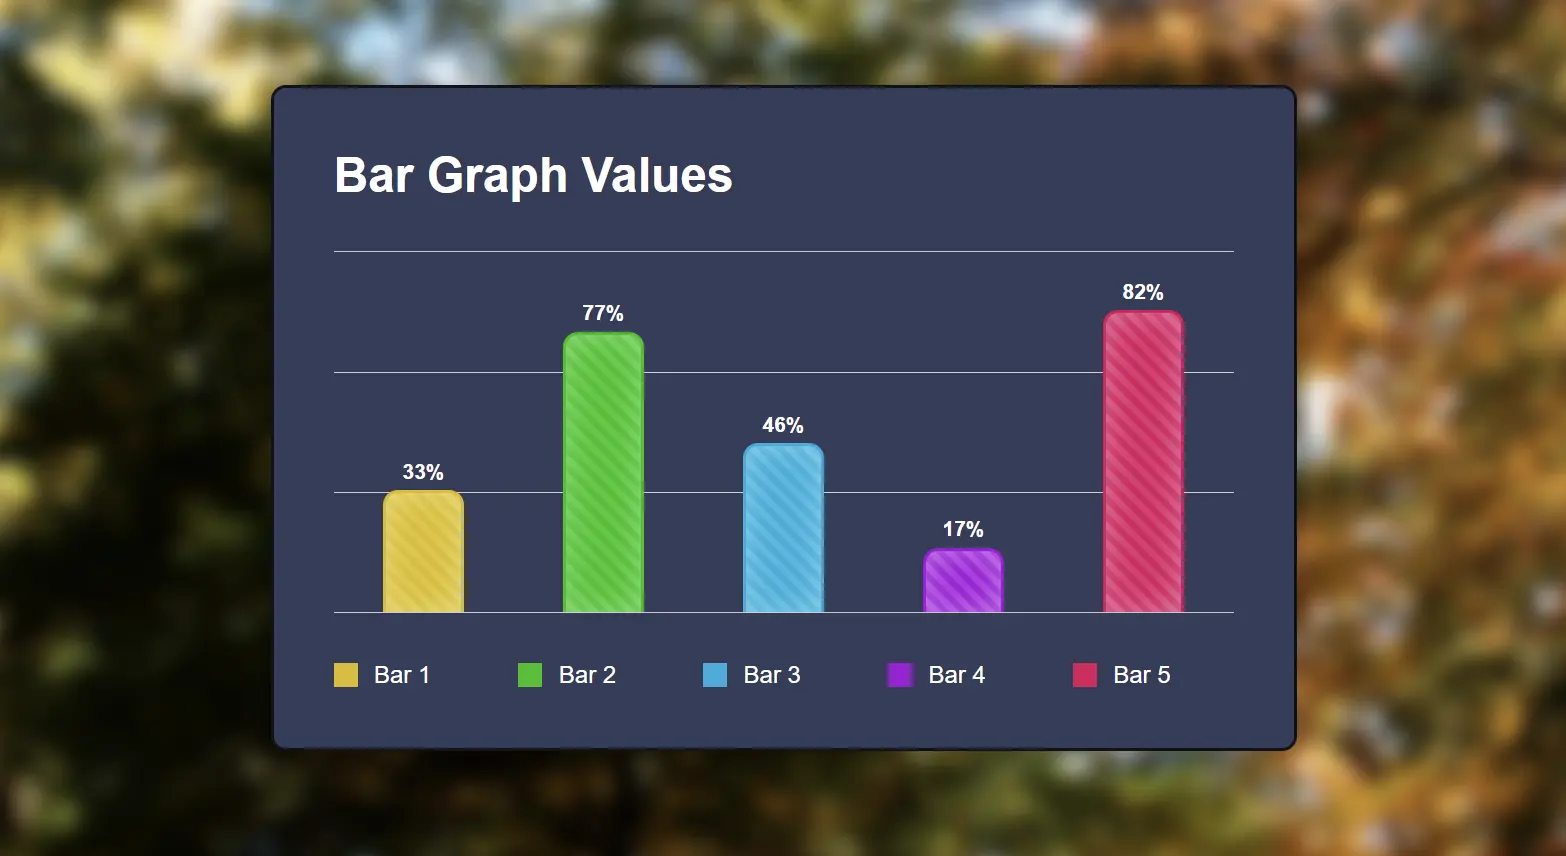
For this example, we create a chart with 5 bars representing our data and a legend underneath to label each bar. The graph gets its width from the container, so you can easily adapt the width and add or remove bars as needed, just note that adding too many bars may get a little cramped and require some adjustment.
Markup
The markup is pretty straight-forward—consisting of a graph title, a <div> to hold the bars, and another to hold the graph key. The main element for our bar graph is going to be a <figure>, since we're displaying a self-contained, graphical representation of our data, and we use a <figcaption> to hold our graph's title.
The bars themselves are going to be grouped together in a parent <div>. So our five bars go in there. We'll worry about the data values in a bit. Notice the classes we're using. They're a simplified implementation of the module/submodule approach. Not so formal as something like B.E.M., but it still allows us to keep our CSS specificity flat while still scoping the submodules to our module. In this case our module is bar-graph, making our data container bar-graph-data and our bars bar-graph-bar.
The legend is just going to be a set of labels to allow us to identify what each bar represents.
Our markup so far looks like this:
<figure class="bar-graph"><figcaption class="bar-graph-title">Bar Graph Values</figcaption><div class="bar-graph-data"><div class="bar-graph-bar"></div><div class="bar-graph-bar"></div><div class="bar-graph-bar"></div><div class="bar-graph-bar"></div><div class="bar-graph-bar"></div></div><div aria-hidden class="bar-graph-legend"><div class="bar-graph-key">Bar 1</div><div class="bar-graph-key">Bar 2</div><div class="bar-graph-key">Bar 3</div><div class="bar-graph-key">Bar 4</div><div class="bar-graph-key">Bar 5</div></div></figure>
Styling
To begin styling, we give our graph some basic styles such as padding, background and rounded corners. We're just covering the styles needed to achieve the layout here, but you can check out the full styles in the completed example below.
Flexbox does the heavy lifting for laying out our bars, so we add display: flex to our .bar-graph-data container. We use justify-content: space-around to make sure the bars are evenly spaced and align-items: flex-end keeps them aligned to the bottom of the grid.
To Finish up our bar layout we add a few graph lines for visual reference. The top and bottom lines are borders on the bar-graph-data element and we add lines at the 1/3 and 2/3 positions using :before and :after pseudo elements absolutely positioned—one at the 33% mark and one at the 66% mark. We also need to add position: relative to the the bar-graph-data and a z-index of 2 to our bars so they cover our visual reference lines,
.bar-graph-data {height: 100%;border-top: 1px solid #ccc;border-bottom: 1px solid #ccc;display: flex;justify-content: space-around;align-items: flex-end;position: relative;margin-top: 2rem;}.bar-graph-data:before,.bar-graph-data:after {content: '';position: absolute;top: 33.333%;width: 100%;border-top: 1px solid #ccc;}.bar-graph-data:after {top: 66.666%}
For the individual bars, we need to set a few basic properties. We give them a set width and a max height of 100% so they don't overrun our graph. The height property, which we set to a CSS custom property, controls how our values are visually represented on the graph. We use percentage values for the height so we get an accurate depiction of our data in relation to the graph's height no matter what size the container is set to. We'll add the correct data to the bars in the next section.
Lastly for the bars, we use the :after pseudo element to add a label to the bar to show the value. For now, set the content any value you want. We'll set it to display the actual data in a bit.
Check out the completed example at the end to see all of the styles used to create the bars visual appearance.
.bar-graph-bar {width: 50px;border-radius: 10px 10px 0 0;height: var(--value, 1px);max-height: 100%;position: relative;z-index: 2;}.bar-graph-bar:after {content: attr(title);position: absolute;bottom: calc(100% + 6px);font-size: .875rem;font-weight: 600;text-align: center;display: block;width: 100%;}
For the legend, we use display: grid and set a few styles for spacing. We make one adjustment for mobile with a media query—this works well for our example, which has 5 short labels, but in practice you may need to make this a little more flexible.
.bar-graph-legend {display: grid;grid-template-columns: repeat(5, 1fr);gap: 1rem;row-gap: 6px;flex-wrap: wrap;margin-top: 32px;}.bar-graph-key {display: flex;align-items: center;}.bar-graph-key:before {content: '';width: 16px;height: 16px;margin-right: 11px;}@media (max-width: 767px) {graph-legend {grid-template-columns: repeat(3, 1fr);}}
Setting the Data Values
Hooking up actual data values to our bars requires setting two attributes on our bar elements. First, add a title attribute to our bar-graph-bar elements which will be displayed in the .bar-graph-bar:after pseudo elements by setting their content attribute to attr(title).
To set the actual height of the bars, we need to set the --value CSS custom property using an inline style attribute. Note that the value can be anything you want, but the height must be a %.
<div class="bar-graph-bar" title="33%" style="--value: 33%;"></div>
Accessibility
For a little bit of accessibility, we can add an aria-label to our bars so that assistive technologies can read our data. Notice that for each bar we include the value and the label from the legend. This means that we can hide the legend with aria-hidden because it's now redundant to screen readers.
There may be more we can do for accessibility here, but this is good for now.
<div class="bar-graph-bar" aria-label="Bar 1: 33%" title="33%" style="--value: 33%;"></div>
Conclusion
So, that's it for our HTML/CSS bar graph.
There are many different enhancements we could add such as animation or support for larger data sets, but for now we have a pretty slick way to show our data.
Here's a look at the finished graph: